Product Analytics

Session Replay, Heatmaps and User Feedback — All-in-One.

Capture detailed video sessions to see how users interact with your website and improve their experience.
See user behavior across your product
Fix issues faster before they grow
Improve conversions with real insights
Setup in minutes. No credit card required.
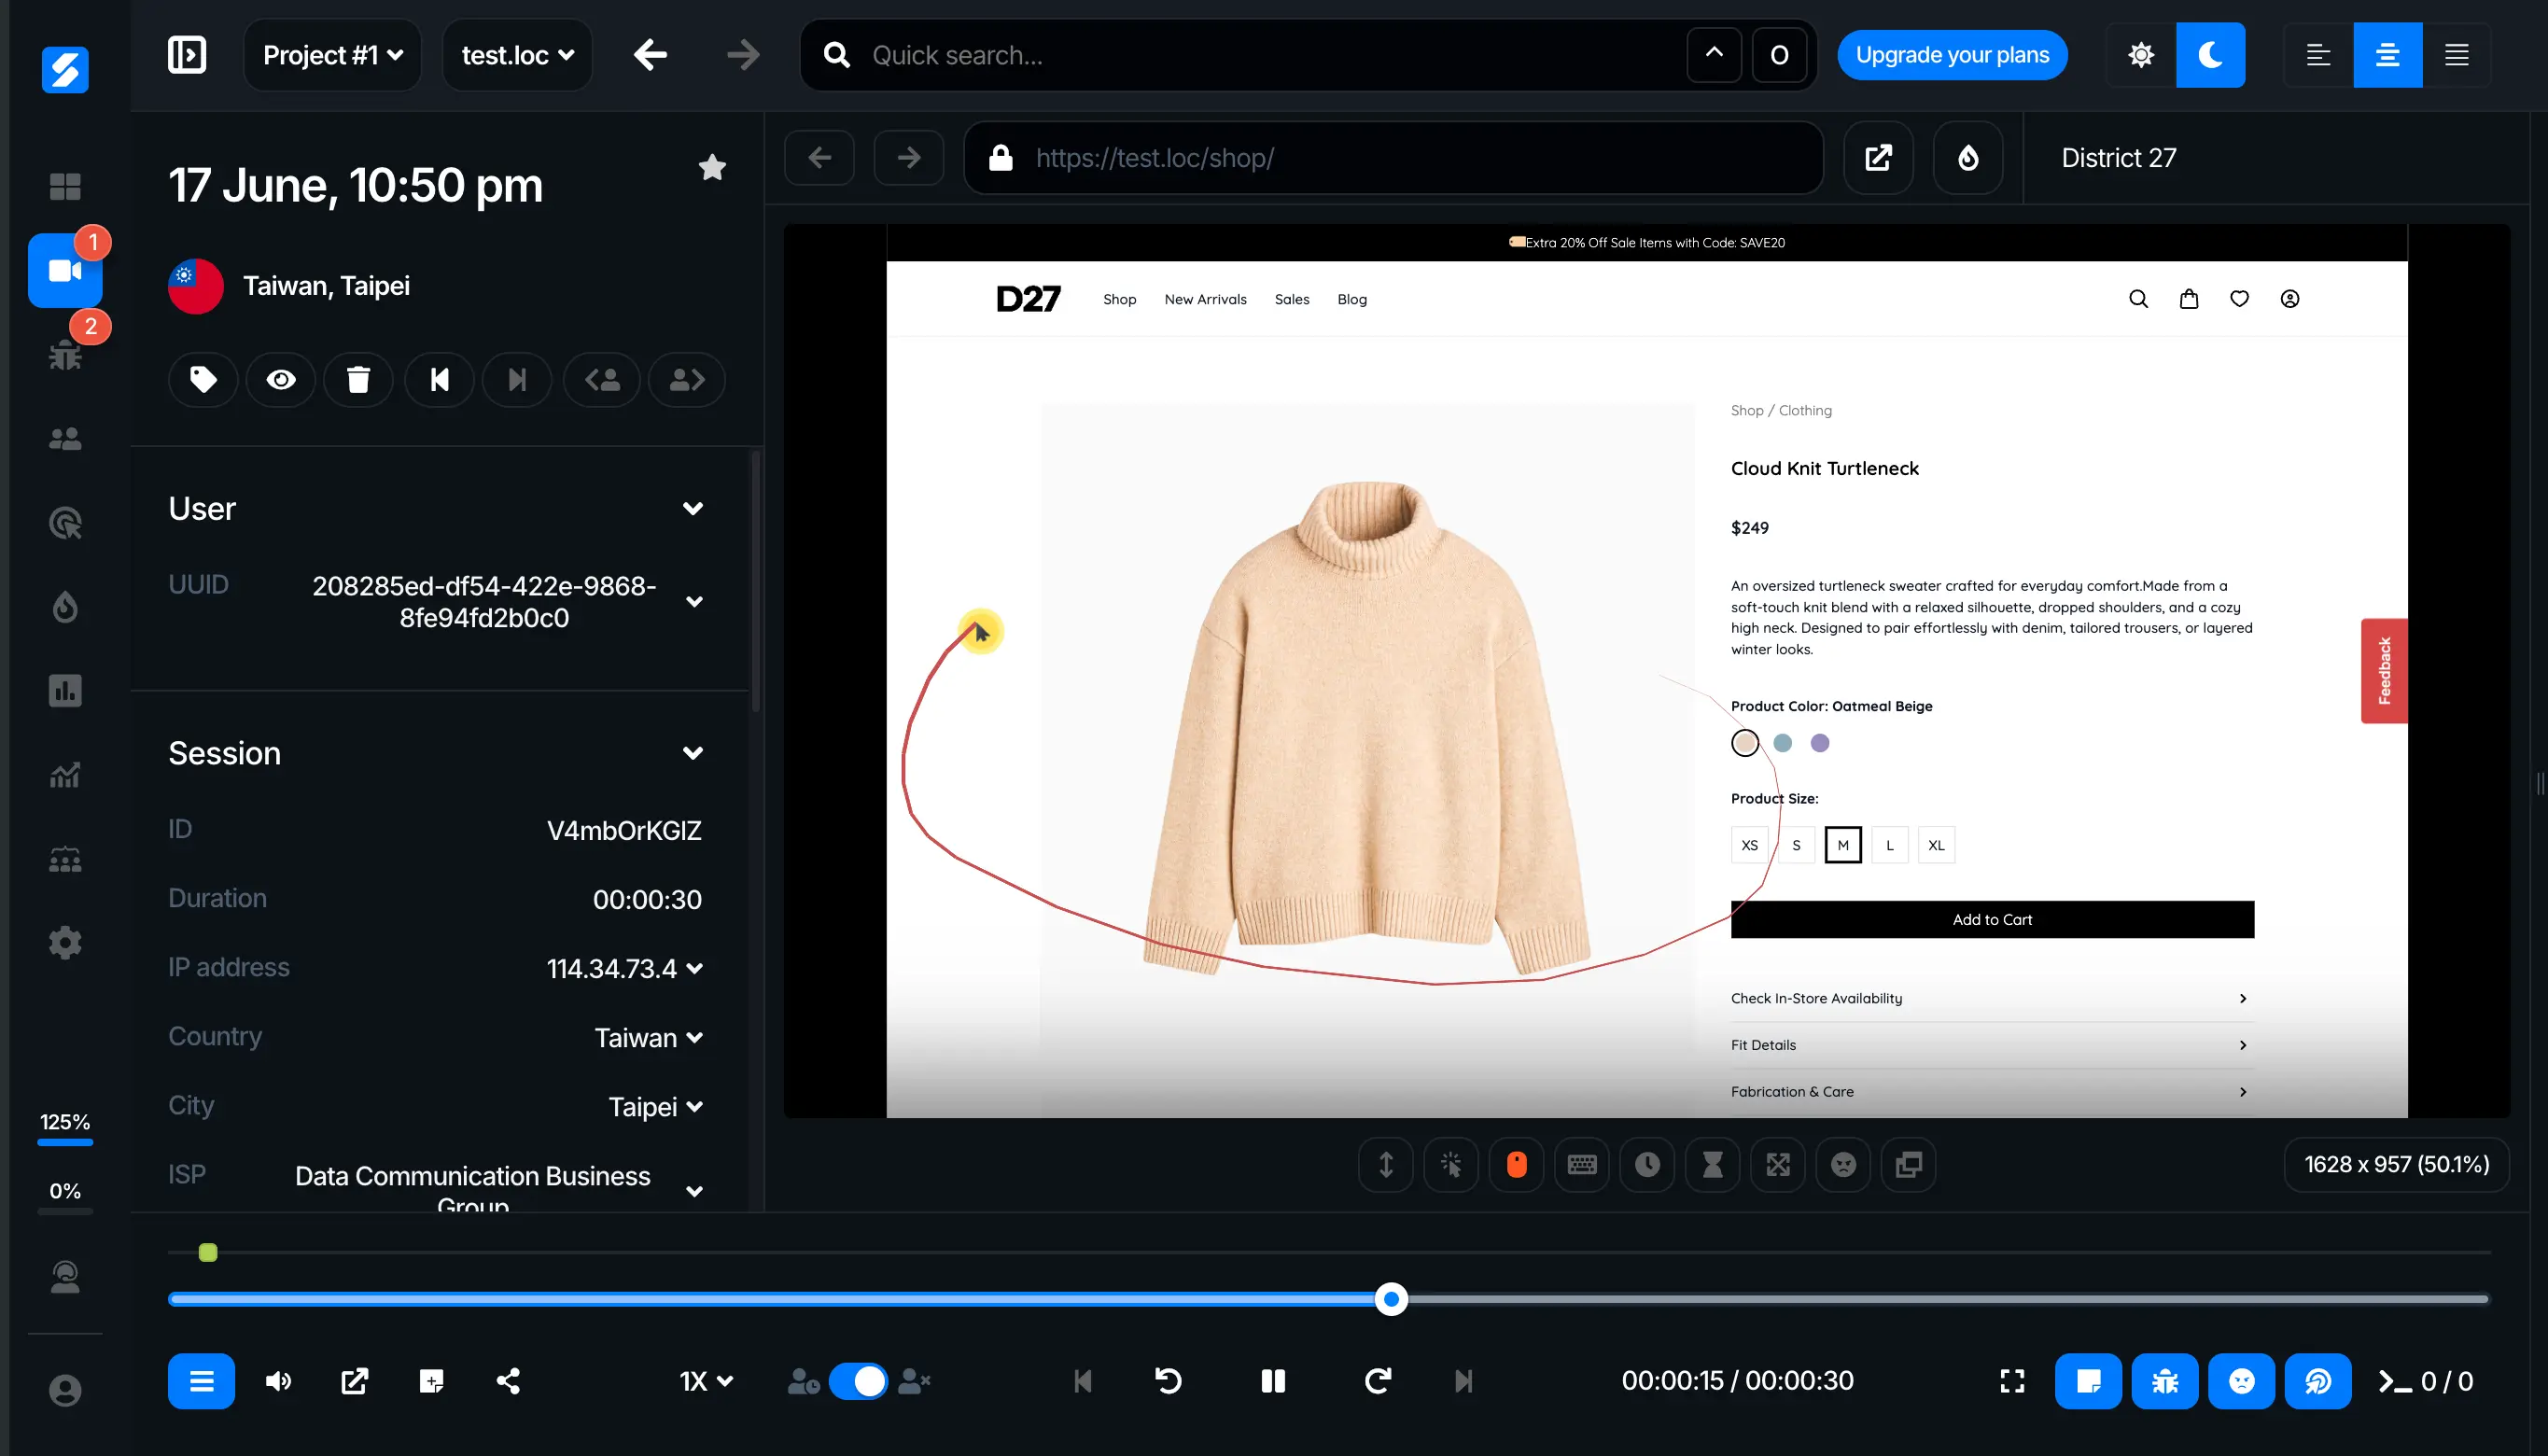
Recordings

See Every User Session

Put yourself in your users' shoes. Record every visitor session and see exactly how users interact with your website — from clicks and scrolling to typing and navigation. Uncover friction, reproduce bugs, and improve the user experience with confidence.
AS
Session #4821
Chrome · macOS · Berlin, Germany
2 errors
example.com/signup
Create your account
Email
anna@example.com
Password
••••••••
Create account
Something went wrong
Console5
Network
Events
0:01
Info
Page loaded in 420 ms
0:03
Log
Field focused: #email
0:10
Warn
Password strength is weak
0:12
Error
TypeError: Cannot read properties of null (reading 'submit') signup.js:84
0:13
Error
POST /api/signup → 500 network
0:20
1×
Skip idle
Reveal Hidden Issues
Experience your website through your users' eyes and uncover usability problems that traditional analytics can't reveal.
Debug Faster
Capture console logs, JavaScript errors alongside every recording to quickly identify and reproduce issues.
Optimize User Experience
See where users hesitate, abandon tasks, or get stuck, then improve every step of the user journey.
Resolve Support Requests
Link support tickets to session recordings and instantly understand what happened before users reported an issue.
Heatmaps
example.com/pricing
Last 7 days · 3,412 page views
Clicks Moves Scroll
example.com/pricing
Choose
Choose
Get started
41% of clicks
Fewer clicks
More clicks

Visualize User Behavior

See where visitors click, move, and scroll across your website. Use heatmaps to understand what attracts attention, what gets ignored, and how users interact with every page.
Discover Hotspots
Identify the areas that attract the most attention and learn what users interact with most.
Improve Layouts
See which elements are overlooked, then optimize page layouts to guide users toward important content.
Increase Conversions
Understand how visitors interact with landing pages, forms, and calls to action to improve conversion rates.
Make Data-Driven Decisions
Replace assumptions with visual insights and confidently optimize your website based on real user behavior.
Product Analytics

See Where Users Drop Off

Turn any journey into a funnel, chart the actions that matter and see who comes back. Every number is built from the sessions you already record, so you can watch the visitors behind it.
Checkout funnel
Last 30 days · Visitors · All devices
23.1% converted
Viewed a product
4,820
Added to cart
2,314
↓ 1,078 dropped off before checkout
Opened checkout
1,236
Purchase completed
1,113
Why they left
Visitor from BerlinLeft on /cart · Payment failed4:12
Visitor from AustinLeft on /cart · 3 rage clicks2:47
Find Drop-Off Points
Build funnels from pages and events and see how many visitors make it through each step.
Watch Why They Left
Open the recordings and console logs of the sessions that stopped at any step.
Track Trends
Chart events and page views by day, week or month, and break them down by their properties.
Measure Retention
See what share of visitors come back after their first visit, sign-up or purchase.
Surveys

Collect Meaningful Feedback

Ask the right questions at the right time with customizable surveys. Understand what users think, why they leave, and what prevents them from reaching their goals.
Reach the Right Users
Show surveys on desktops, tablets or phones, and only to visitors in an audience — or outside it — to collect relevant feedback.
Ask at the Perfect Moment
Let visitors open a survey from its label, show it automatically on exit intent or after a set time on your website, or open it from your own code.
Learn What Users Need
Collect ratings, opinions, and suggestions to uncover pain points and improve your product with confidence.
Turn Feedback into Action
Analyze responses, identify trends, and prioritize improvements based on real customer feedback.
example.com/dashboard
How likely are you to recommend us to a friend?
1
2
3
4
5
6
7
8
9
10
Worse
Better
Back
Skip
Continue